So, it is just around the corner. Everyone knows that Black Friday is the day that you grab a bargain. You literally can get your hands on expensive goodies without having to fork out significant amounts for them.
Shoppers around the globe can get online and order and save over 50% on essential items that would never have been affordable around the year. You can get the best deals all at a fraction of the price, and this 2021 Black Friday is no different from the rest.
This year will see you being able to get a head start in your festive seasonal shopping and grab promotional deals that are so enticing that even scrooge would like to part with his cash! You can shop in the store or online and save, save, save.
So we have found the best sales the statistics and the patterns of Black Friday selling. You will uncover the trends that you can use to help your business profit from Black Friday.
The day kick starts the frenzy holiday shopping season with eye-catching promotional deals that lure shoppers into spending their hard-earned cash.
Whether it's making a tour to the mall for a discounted offer or buying online from the comfort of the couch, it is a day when shopping shifts into high gear, ensuring that you are well ahead of the starting line and have an advantage over your competitors.
Must-Know Black Friday Statistics You Cannot Miss Out On!
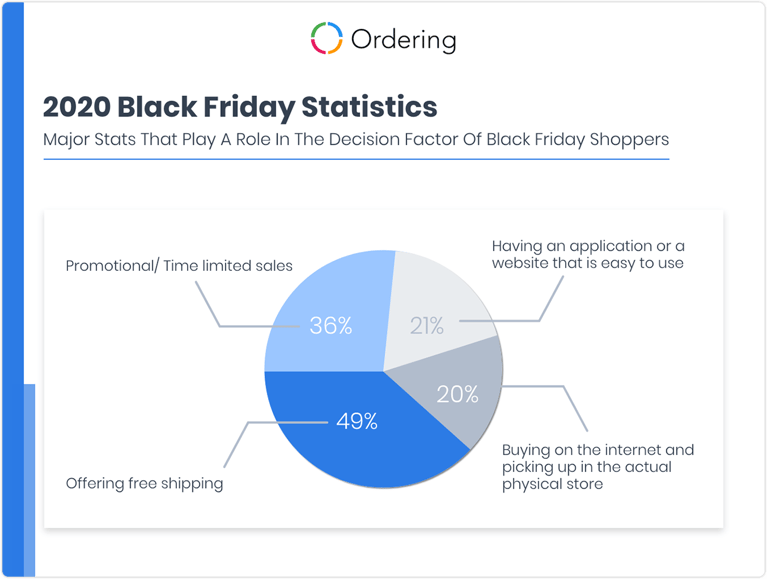
Major Stats That Play A Role In The Decision Factor Of Black Friday Shoppers
● Promotional; / Time limited Sales 36% ● Offering free shipping 49% ● Having an application or a website that is easy to use 21% ● Buying on the internet and picking up in the actual physical store 20%
Since the year 2017, the number of Black Friday shoppers has skyrocketed! The figures are impressive. In 2017 there were 174.6 million, fast forward to 2019, and there was a staggering 189.4 million Black Friday shoppers.
Now, however, after the pandemic, the figure dropped to 186.4 million; however, the number of online shoppers that will participate with online Black Friday buying is an impressive 100 million, and that means that in the past year alone, the figure of online shoppers has increased by a staggering 8%.
Who Shops Online More?
Millennials love the whole online shopping concept when it comes to bagging a Black Friday bargain. 37% of baby boomers also love to do so. 39% of gen x shop for Black Friday on the internet.
Know your audience very well with these great stats! Another surprising statistic that you may not know is that a whopping 31% of Black Friday shoppers prefer to go into the physical store.
The reason being is that they genuinely enjoy the commotion and the frenzy caused by the Black Friday sales! They love to be in a crowded environment and join in large queues and stampedes to get at their favorite Black Friday bargains.
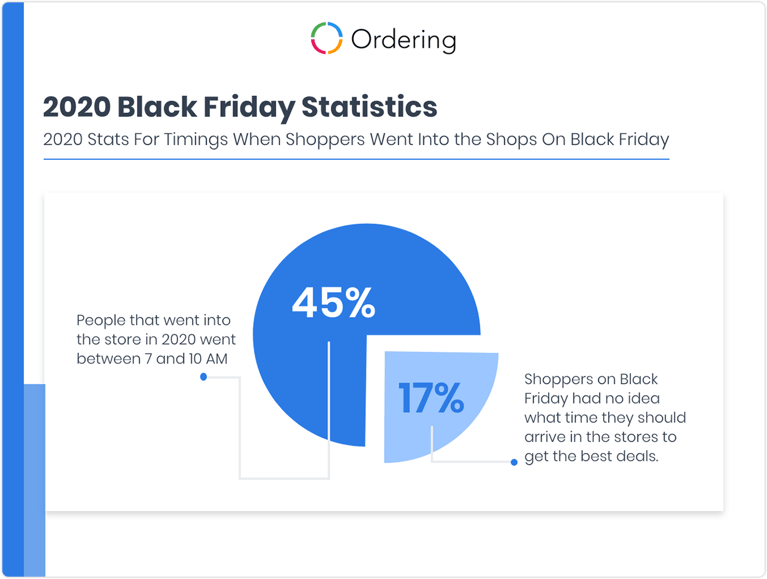
2020 Stats For Timings When Shoppers Went Into the Shops On Black Friday
● 45% of people that went into the store in 2020 went between 7 and 10 AM. ● 17% of shoppers on Black Friday had no idea what time they should arrive in the stores to get the best deals.
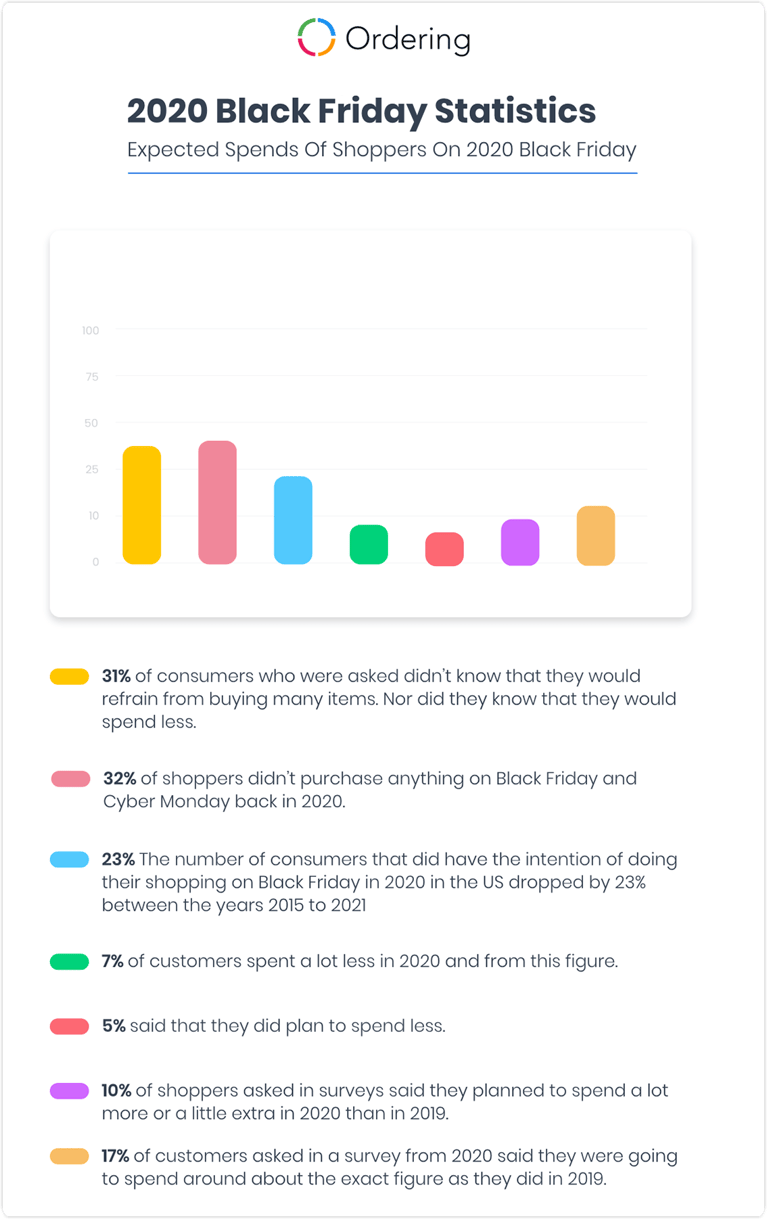
Expected Spends Of Shoppers On 2020 Black Friday
●31% of consumers who were asked didn't know that they would refrain from buying many items. Nor did they know that they would spend less. ●32% of shoppers didn't purchase anything on Black Friday and Cyber Monday back in 2020. ● The number of consumers that did have the intention of doing their shopping on Black Friday in 2020 in the US dropped by 23% between the years 2015 to 2021 ●7% of customers spent a lot less in 2020 and from this figure. Out of this figure, 5% said that they did plan to spend less. ●10% of shoppers asked in surveys said they planned to spend a lot more or a little extra in 2020 than in 2019. ●17% of customers asked in a survey from 2020 said they were going to spend around about the exact figure as they did in 2019.
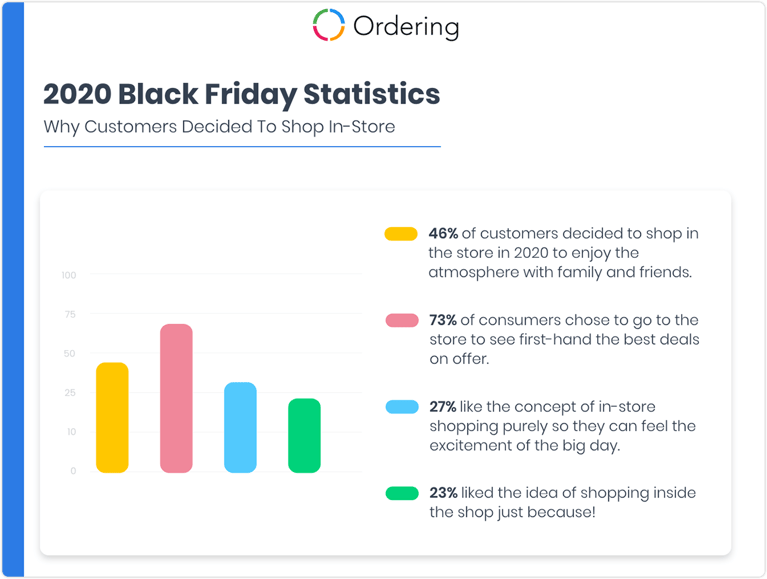
Why Customers Decided To Shop In-Store ● 46% of customers decided to shop in the store in 2020 to enjoy the atmosphere with family and friends. ●73% of consumers chose to go to the store to see first-hand the best deals on offer. ●27% like the concept of in-store shopping purely so they can feel the excitement of the big day. ●23% liked the idea of shopping inside the shop just because!
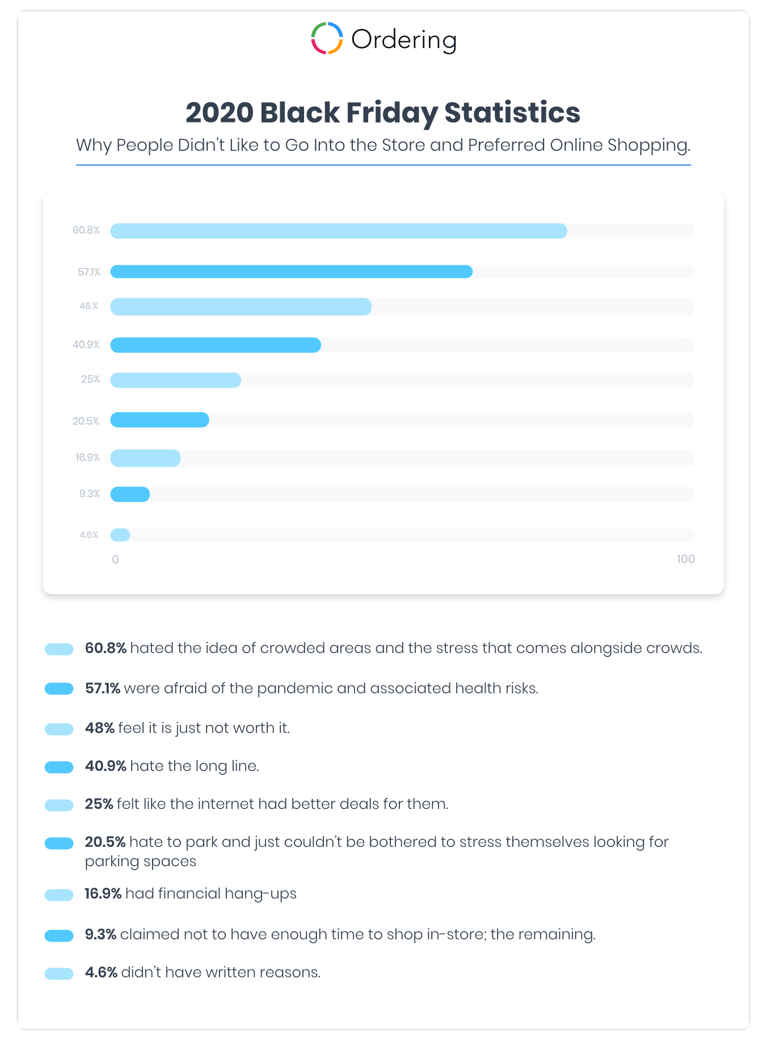
Why People Didn't Like to Go Into the Store and Preferred Online Shopping
●60.8% hated the idea of crowded areas and the stress that comes alongside crowds. ●57.1% were afraid of the pandemic and associated health risks ●48% feel it is just not worth it, while 40.9% hate the long line ●25% felt like the internet had better deals for them ●20.5% hate to park and just couldn't be bothered to stress themselves looking for parking spaces. ●16.9% had financial hang-ups. ●9.3% claimed not to have enough time to shop in-store; the remaining 4.6% didn't have written reasons.